Cardio Vascular Risk Detection
Description
I explored various Unsupervised learning algorithms on Cardiovascular Risk Detection Data. I sought to contribute to the early identification and mitigation of cardiovascular risks, a paramount concern for global public health. Through this endeavor, I aimed to pave the way for more effective preventive strategies and informed medical interventions, ultimately leading to a reduction in cardiovascular-related morbidities and enhancing the overall quality of patient care
Variables Description
Demographic:
Sex: male or female (“M” or “F”) Age: Age of the patient (Continuous - Although the recorded ages have been truncated to whole numbers, the concept of age is continuous) Education: The level of education of the patient (categorical values - 1,2,3,4)
Behavioral:
- is_smoking: whether or not the patient is a current smoker (“YES” or “NO”) Cigs Per Day: the number of cigarettes that the person smoked on average in one day.(can be considered continuous as one can have any number of cigarettes, even half a cigarette.) Medical (history):
- BP Meds: whether or not the patient was on blood pressure medication (Nominal) Prevalent Stroke: whether or not the patient had previously had a stroke (Nominal)
- Prevalent Hyp: whether or not the patient was hypertensive (Nominal) Diabetes: whether or not the patient had diabetes (Nominal) Medical (current):
- Tot Chol: total cholesterol level (Continuous)
- Sys BP: systolic blood pressure (Continuous)
- Dia BP: diastolic blood pressure (Continuous)
- BMI: Body Mass Index (Continuous)
- Heart Rate: heart rate (Continuous - In medical research, variables such as heart rate though in fact discrete, yet are considered continuous because of large number of possible values.)
- Glucose: glucose level (Continuous) Predict variable (desired target):
- 10-year risk of coronary heart disease CHD(binary: “1”, means “Yes”, “0” means “No”)

Data sources
I have sourced the dataset from Kaggle. Please find more information here.
Please add your kaggle.json to the root directory to access the data
The dataset provided information on over 4,000 patients and included 15 attributes, each representing a potential risk factor for CHD. These attributes included demographic, behavioral, and medical risk factors.
Exploratory Data Analysis
- Post loading the dataset, I conducted basic Exploratory data analysis. I started with visualizing various patterns in the data, using HistPlot and PairPlot features in Seaborn.

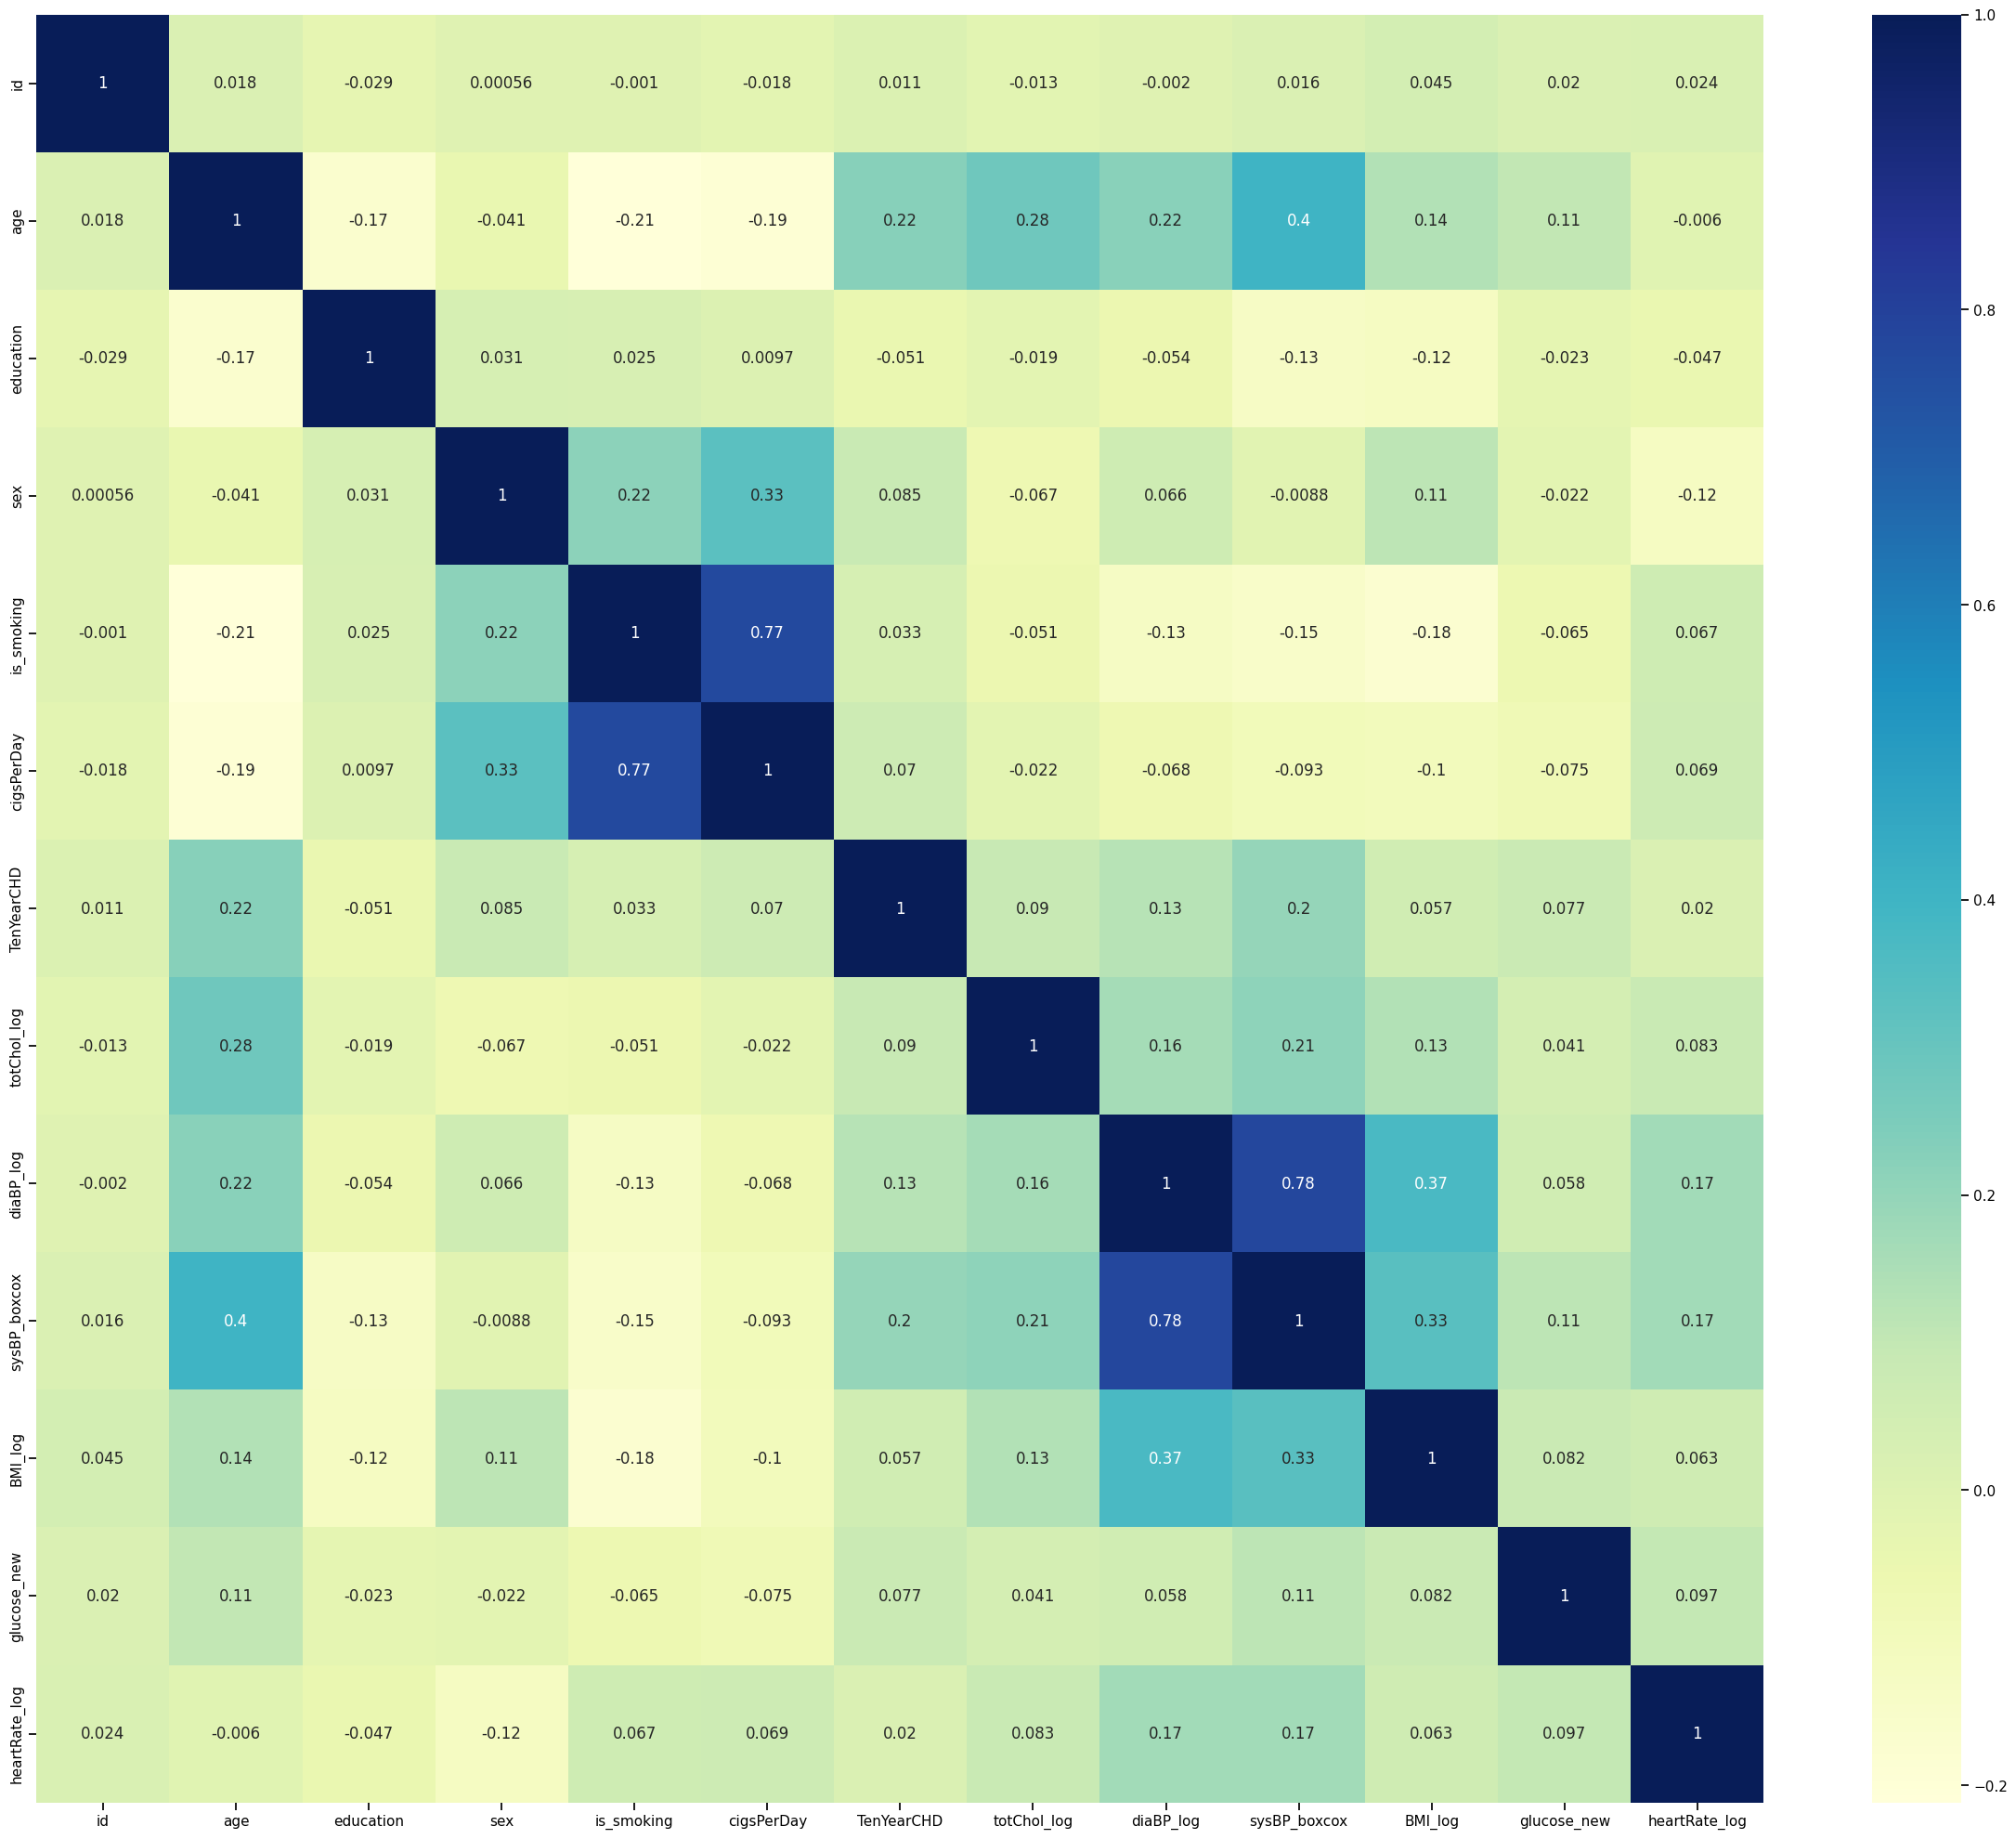
- Label Econding was performed on string feature of “sex” and “is_smoking”. Absolute value correlation between every feature was analysed and plotted to as the following:

- Skew transformation was conducted on skewed data, using log, square root and boxcox transformations.

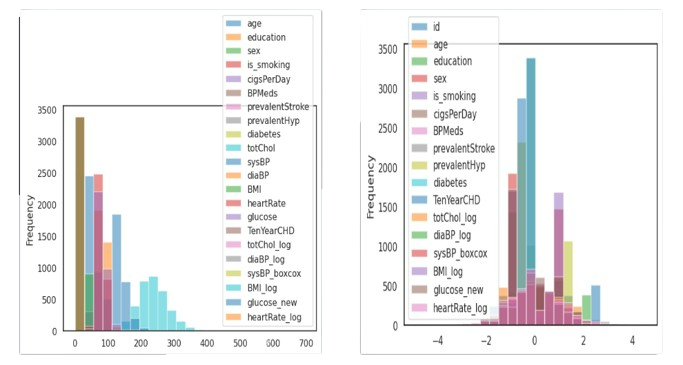
- On handling outliers, the data was scaled using StandardScalar to better fit the classification model. The difference is shown here:

- A multicollinearity graph gives more insight into the relation between each feature.

Machine Learning Models and Accuracy
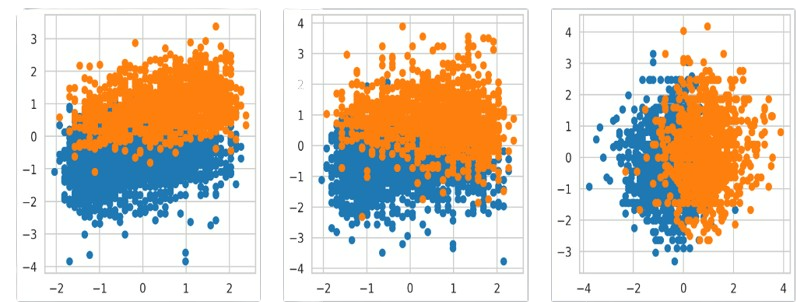
- I applied K-Means Clustering algorithm on the data, restricting no. of clusters to 2, and the results were as follows:

- Further, I applied soft clustering algorithms(returns probabilities of each data point belonging to all k clusters) like GMM(Gaussian Mixture Model). Using a Decision Tree Classifier gave the accuracy score 0.78

-
DBSCAN(density-based clustering non-parametric algorithm) clustered data into 5 groups with 318 points of noise, performing poorly with the data. Similarly, mean-shift clustering failed to group the data.
-
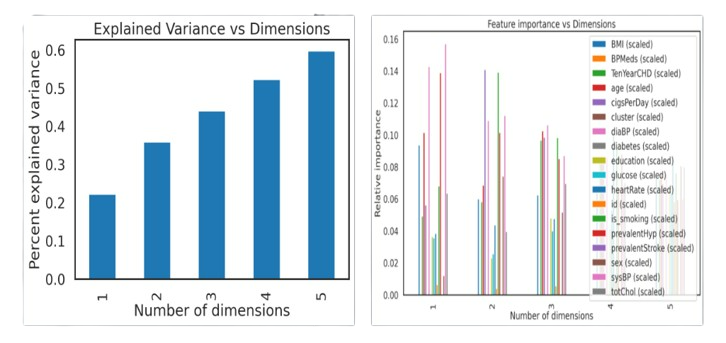
In order to reduce dimensions and work more efficiently with the data, PCA(Principal Component Analysis) was used. The plot shows the accumulated explained variance ratio for the fitted PCA object.

- PCA analysis showed that we can keep the first 12 components and discard the other 6, keeping >=99.0% of the explained variance. Variance explained by dimensions(left) and Feature importance Vs Dimensions(right) is shown below. This improved the accuracy score when applied to above algorithms to 0.84.

Conclusion
I conducted an in-depth exploration of diverse Unsupervised learning algorithms utilizing Cardio-vascuar Risk data, revealing compelling patterns. These findings have the potential to offer valuable insights into heart health, thereby informing medical institutions and guiding preventive measures.