Crop Data Visualisation
An interactive visual dashboard for analysing crop production statistics and geographic trends along with rainfall correlation assessment and water resource strain assessment
Tasks
We have implemented the following tasks in the dashboard:
- Task 1: To analyze crop production statistics across the nation (district-wise)
- Task 2: To analyze trends in crop production over the years
- Task 3: To correlate rainfall pattern with crop production trends
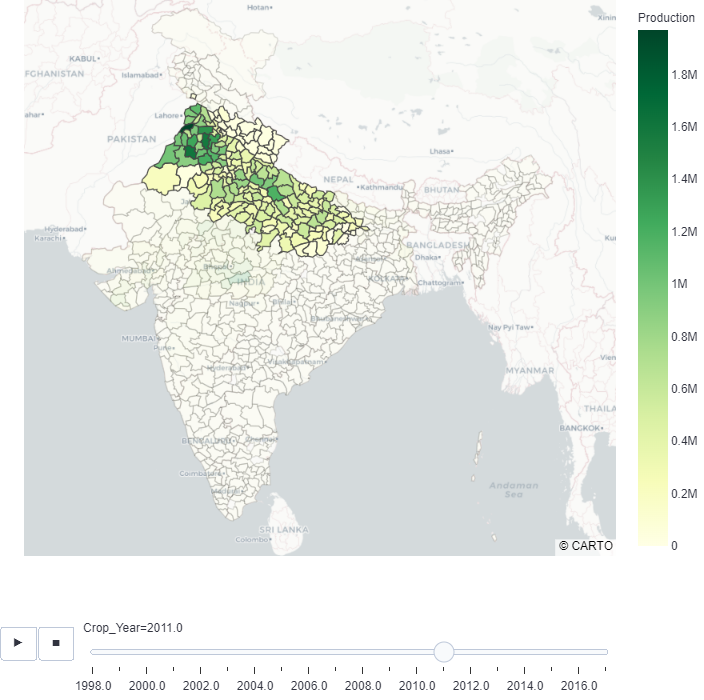
Task 1 Analysis
- Punjab, Haryana, and Uttar Pradesh were the first Indian states to cultivate wheat.
- Today, Madhya Pradesh and Rajasthan have joined the list of the largest Wheat-producing states.
- Govt. policies and missions like NFSM, RKVY, PMFBY, subsidies, and farmer knowledge caused the change.
Task 2 Analysis
Cereals
- Rice and Wheat were cultivated most, over all the years
- Bajra production peaked in 2012 and decreased henceforth
- Jowar production decreased overall, and consistently after 2008
- Millet production has decreased over the years, especially since 2010. The proportion of other crops(crop diversity) has decreased
Pulses
- Proportion of moong has decreased over the years
- Moth and Horse-gram production has decreased
Task 3 Analysis(Rainfall correlation)
-
Bajra, and Gram are dry land crops and are hence, most grown in Rajasthan and Madhya Pradesh(low rainfall).
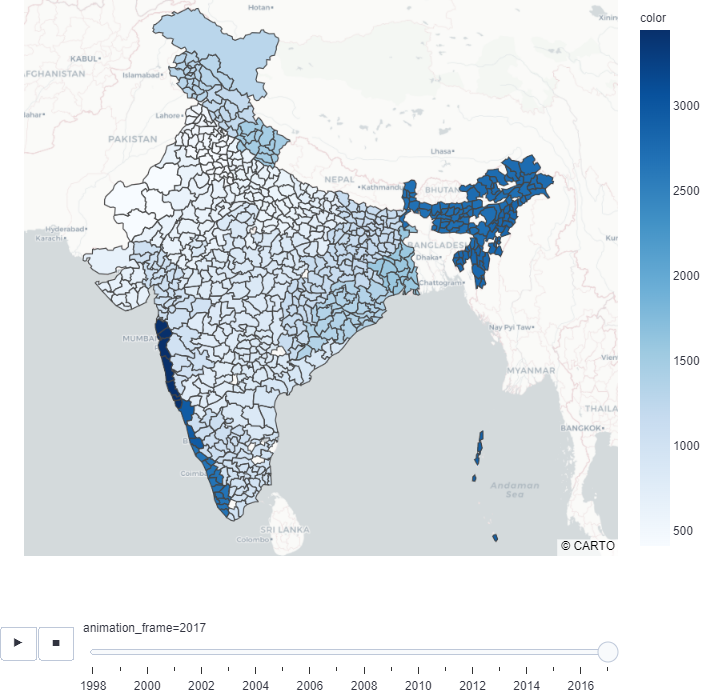
- Rice cultivation is also concentrated to high rainfall areas(like the East coast) owing to its water requirements
- The extensive rice cultivation in the Punjab-Haryana region in the absence of sufficient rainfall explains the rainfall issues faced there
