Medical Insurance Prediction
Description
In an era where healthcare costs continue to rise and uncertainty looms over medical expenses, accurate prediction of medical insurance costs has emerged as a crucial aspect of informed financial planning. The project centers around the implementation of regression analysis, a cornerstone of predictive modeling in data science, and various methods to enhance its accuracy.
Introduction
Many factors that affect how much we pay for health insurance are not within your control. Nonetheless, it’s good to have an understanding of what they are. Here are some factors that affect how much health insurance premiums cost:
Age: age of primary beneficiary Sex: insurance contractor gender, female, male BMI: Body mass index, providing an understanding of body, weights that are relatively high or low relative to height, objective index of body weight (kg / m ^ 2) using the ratio of height to weight, ideally 18.5 to 24.9 Children: Number of children covered by health insurance / Number of dependents Smoker: Smoking Region: the beneficiary’s residential area in the US, northeast, southeast, southwest, northwest
Data sources
I have sourced the dataset from Kaggle. Please find more information here.
Please add your kaggle.json to the root directory to access the data
Exploratory Data Analysis
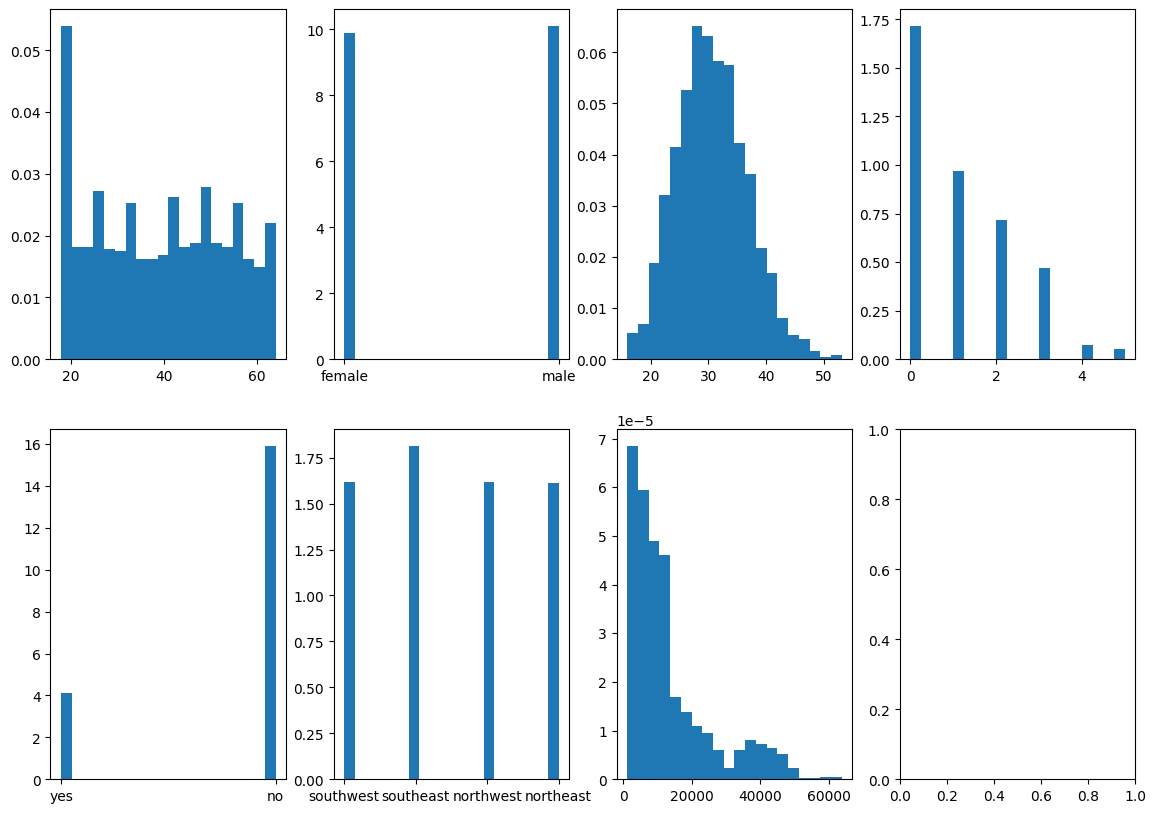
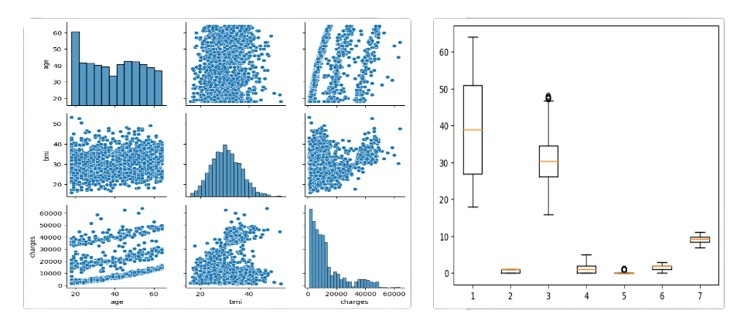
Post loading the dataset, I conducted basic Exploratory data analysis. I performed skew transformation on features, applied label encoding on string feature(region) and used StandardScalar to scale the data. I have visualized various patterns in the data:
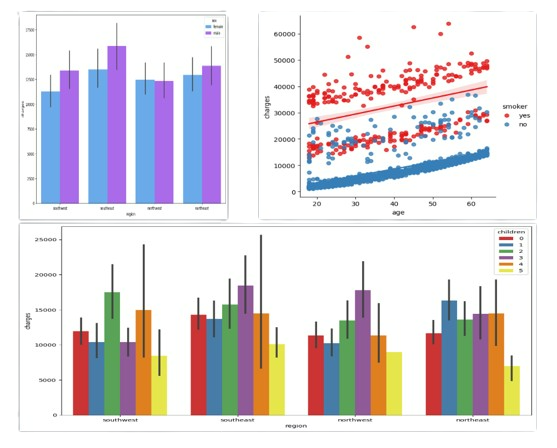
As we can see, the highest charges due to smoking are still in the Southeast but the lowest are in the Northeast. People in the Southwest generally smoke more than people in the Northeast, but people in the Northeast have higher charges by gender than in the Southwest and Northwest overall. And people with children tend to have higher medical costs overall as well. Smoking has the highest impact on medical costs, even though the costs are growing with age, bmi and children.
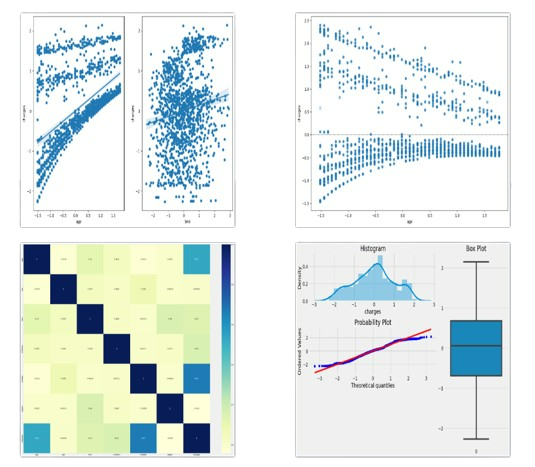
Linearity Assumption, Homodescedasity and Multicollinearity plots reveal linear patterns and correlation in the data. The following plots the Normality of the target variable:
Regression Models and Accuracy
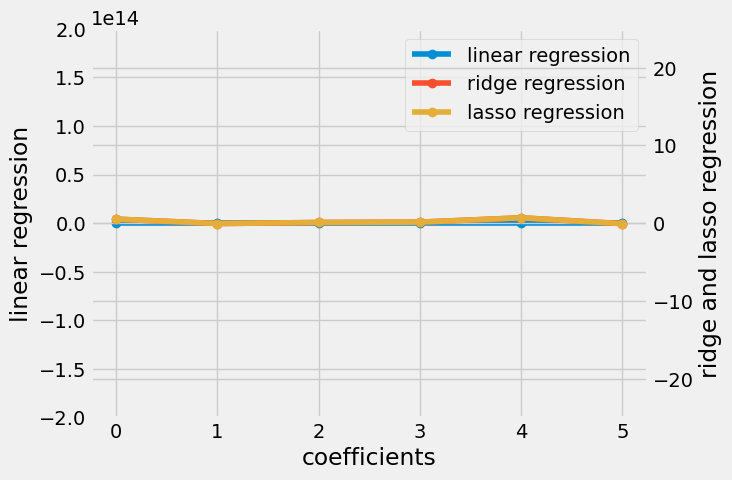
- I applied Linear Regression on the data and obtained an rmse score of 0.48. I compared Ridge, Lasso and ElasticNet Regularization methods to reduce errors and prevent overfitting. Little variation was found in the scores given by each, best being ElasticNet method.
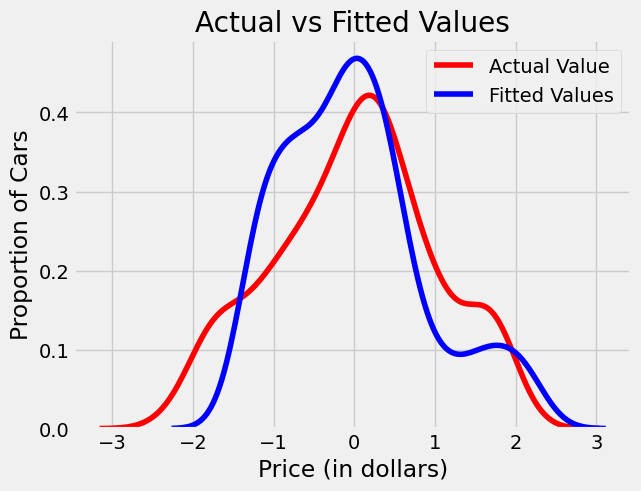
- Accuracy was slightly improved using Random Forest Regressor. The actual and fitted values were visualized as the following:
-
Grid Search was used for hyper parameter tuning, and optimized polynomial feature extraction to 2 features.
-
A pipeline object was created using Polynomial Features and Random Forest Regressor, increasing the accuracy score to 0.86.
Conclusion
I conducted an in-depth exploration of diverse regression algorithms utilizing medical insurance data, revealing compelling patterns. These findings have the potential to offer valuable insights into healthcare expenditure, thereby informing policy formulation and family planning strategies